
Use suggested dashboards
Start with Accoil's suggested dashboards, then use the right view for the question you are investigating.
Suggested dashboards are ready-made collections of metric cards for common product questions. They are a useful place to start when you want a shared view of activity, engagement, adoption, or retention without assembling a dashboard first.
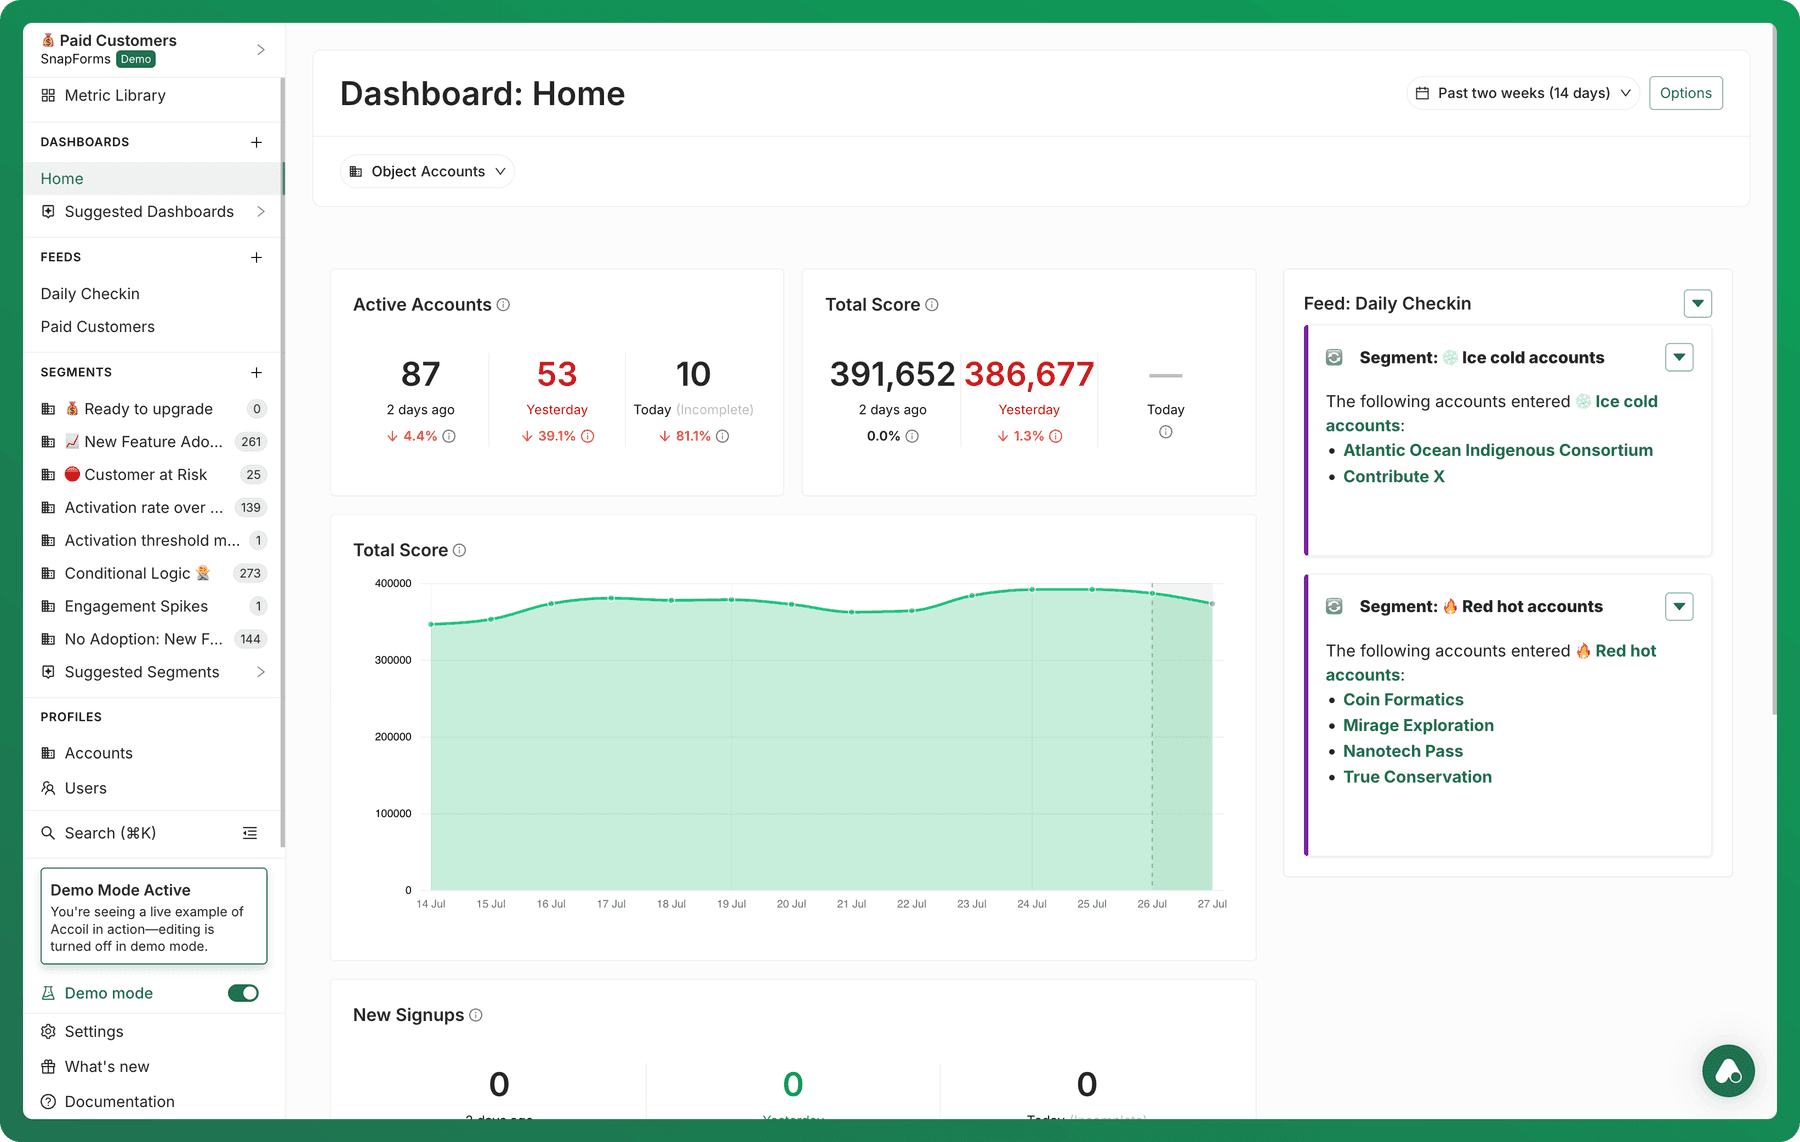
Choose a dashboard by the question you have
| Dashboard | Use it to explore |
|---|---|
| Home | A broad view of the metrics your workspace uses most often. |
| Activation | Progress toward the activation criteria configured for users or accounts. |
| Active | How many users or accounts are active over the selected period. |
| Engagement | Engagement and score-related trends. |
| Events | Event activity and event-related metrics. |
| Features | Feature adoption and feature usage. |
| Retention | Returning usage and retention trends. |
| Segments | Segment-related metrics. |
| Signups | Signup-related metrics. |
The metric cards shown on a suggested dashboard are curated by Accoil. Use the card title and description to understand the question each one answers, then open the relevant metric reference for the full definition.
Change the context before comparing a result
Use the controls in the dashboard header to change the period or object you are looking at. Where relevant, dashboards can also let you choose a feature or event.
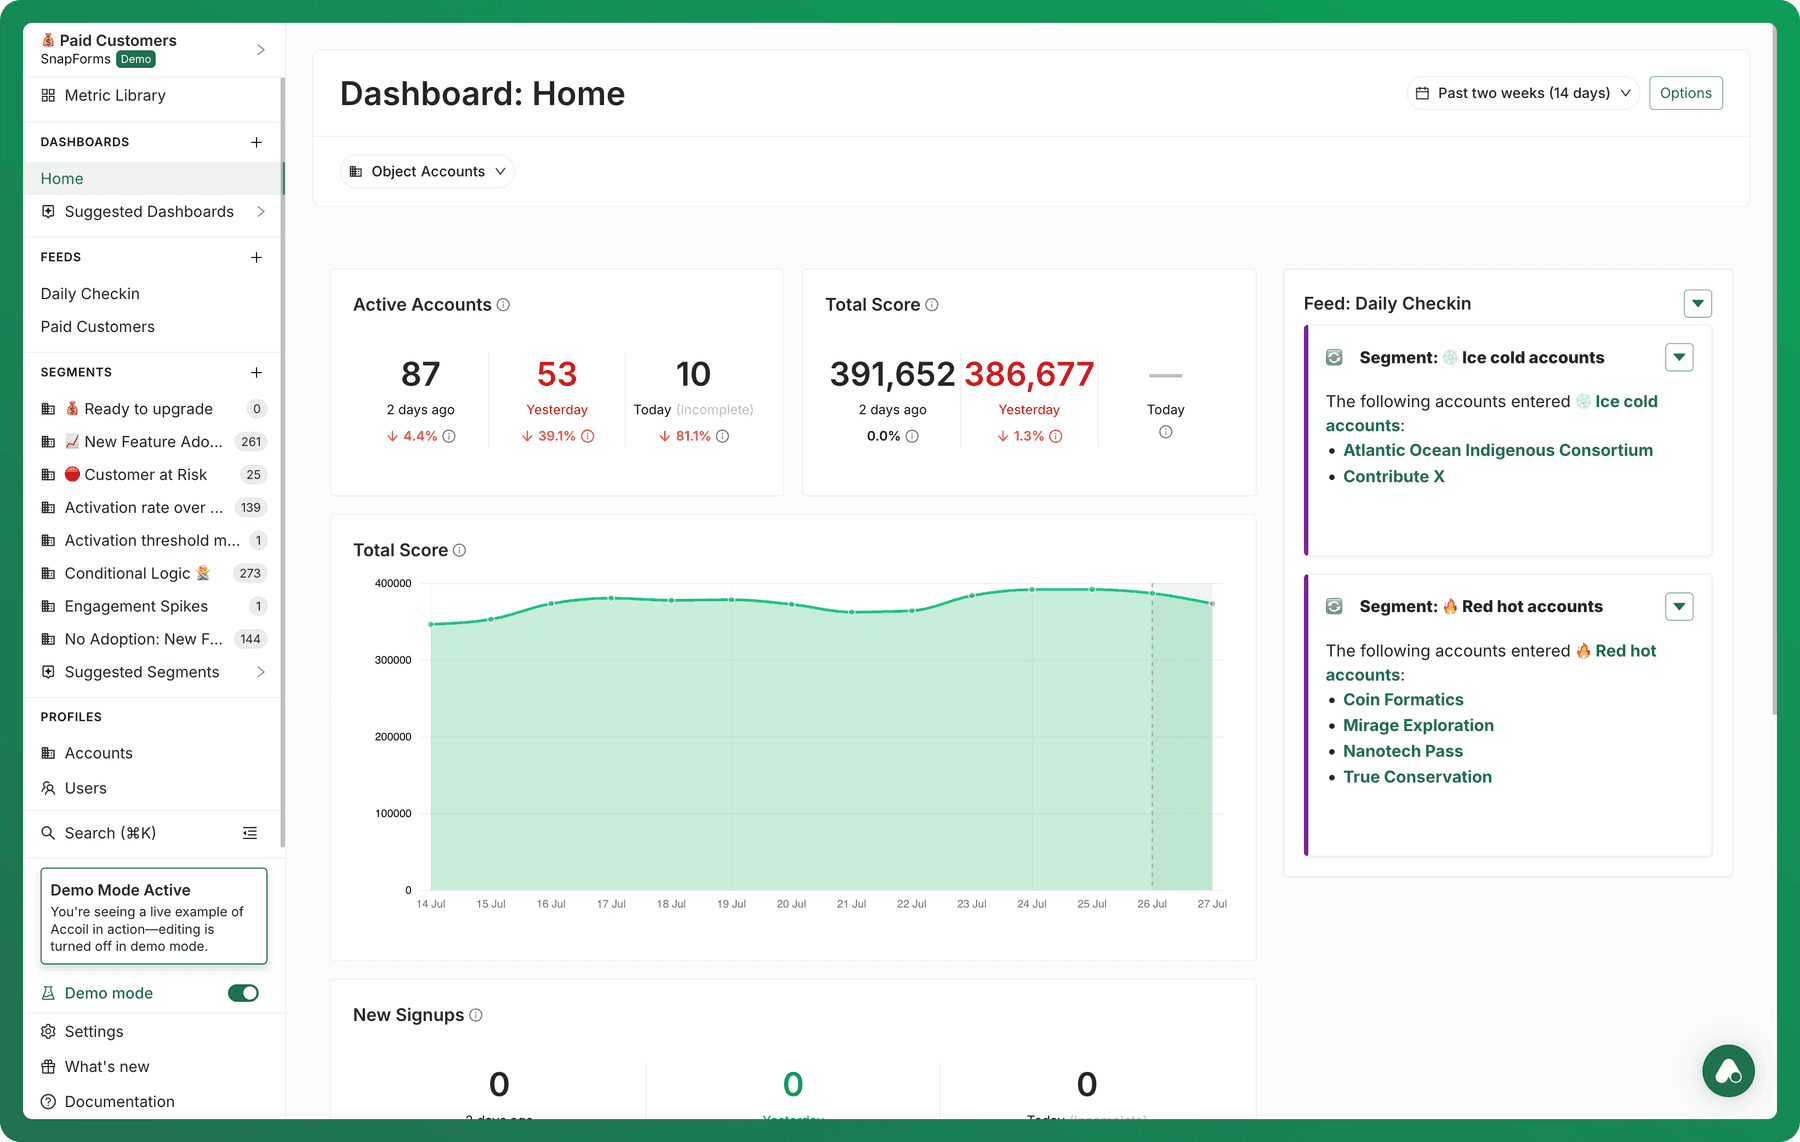
Changing the period, object, feature, event, or a card-specific control changes the answer shown by the dashboard. Check those controls before comparing a result with another dashboard or a previous report.
Start here, then tailor the view
Suggested dashboards are not a limit on what your team can report on. When the metrics you need do not belong together in a suggested dashboard, create a custom dashboard and add metric cards from the Metric Library.